
Phase diagrams and Pourbaix diagrams#
- class ase.phasediagram.PhaseDiagram(references, filter='', verbose=True)[source]#
Phase-diagram.
- references: list of (name, energy) tuples
List of references. The energy must be the total energy and not energy per atom. The names can also be dicts like
{'Zn': 1, 'O': 2}which would be equivalent to'ZnO2'.- filter: str or list of str
Use only those references that match the given filter. Example:
filter='ZnO'will select those that contain zinc or oxygen.- verbose: bool
Write information.
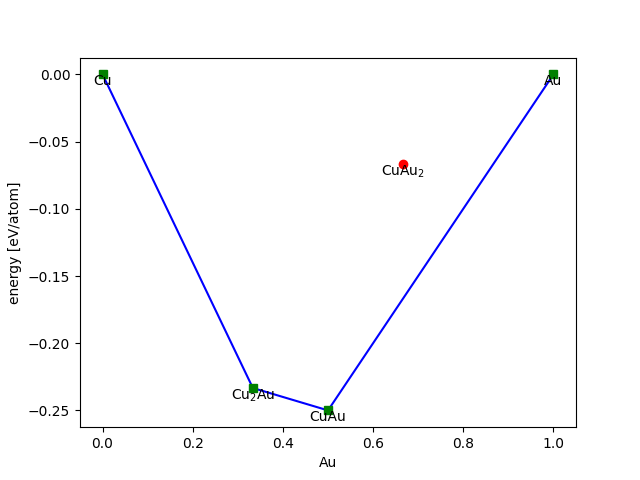
Here is a simple example using some made up numbers for Cu-Au alloys:
>>> from ase.phasediagram import PhaseDiagram
>>> refs = [('Cu', 0.0),
...         ('Au', 0.0),
...         ('CuAu', -0.5),
...         ('Cu2Au', -0.7),
...         ('Cu2Au', -0.2)]
>>> pd = PhaseDiagram(refs)
Species: Au, Cu
References: 5
0    Cu             0.000
1    Au             0.000
2    CuAu          -0.500
3    Cu2Au         -0.700
4    CuAu2         -0.200
Simplices: 3
The convex hull looks like this:
>>> pd.plot(show=True)
- PhaseDiagram.plot(ax=None, dims=None, show=False, **plotkwargs)[source]#
Make 2-d or 3-d plot of datapoints and convex hull.
Default is 2-d for 2- and 3-component diagrams and 3-d for a 4-component diagram.
If you want to see what Cu3Au will decompose into, you can use the
decompose() method:
>>> energy, indices, coefs = pd.decompose('Cu3Au')
reference    coefficient      energy
------------------------------------
Cu                     1       0.000
Cu2Au                  1      -0.700
------------------------------------
Total energy:                 -0.700
------------------------------------
>>> print(energy, indices, coefs)
(-0.69999999999999996, array([0, 3], dtype=int32), array([ 1.,  1.]))
Alternatively, one could have used pd.decompose(Cu=3, Au=1).
- PhaseDiagram.decompose(formula=None, **kwargs)[source]#
Find the combination of the references with the lowest energy.
- formula: str
Stoichiometry. Example:
'ZnO'. Can also be given as keyword arguments:decompose(Zn=1, O=1).
Example:
pd = PhaseDiagram(...)
pd.decompose(Zn=1, O=3)
Returns energy, indices of references and coefficients.
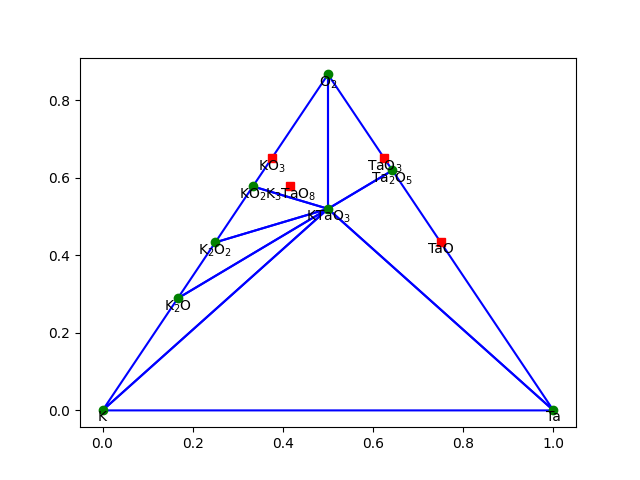
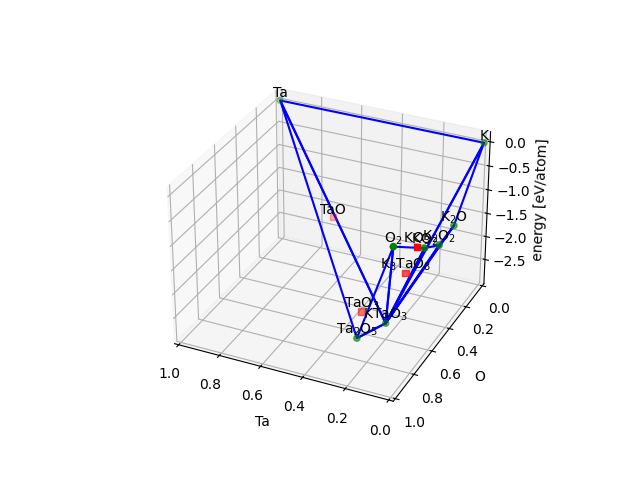
Here is an example (see ktao.py) with three components using
plot(dims=2) and plot(dims=3):
Pourbaix diagrams#
Let’s create a Pourbaix diagram for ZnO from experimental numbers.
We start by collecting the experimental formation energies of
solvated zinc-containing ions and molecules by using the solvated() function:
>>> from ase.pourbaix import Pourbaix
>>> from ase.phasediagram import solvated
>>> refs = solvated('Zn')
>>> print(refs)
[('HZnO2-(aq)', -4.801274772854441), ('ZnO2--(aq)', -4.0454382546928365), ('ZnOH+(aq)', -3.5207324675582736), ('ZnO(aq)', -2.9236086089762137), ('H2O(aq)', -2.458311658897383), ('Zn++(aq)', -1.5264168353005447), ('H+(aq)', 0.0)]
- ase.phasediagram.solvated(symbols)[source]#
Extract solvation energies from database.
- symbols: str
Extract only those molecules that contain the chemical elements given by the symbols string (plus water and H+).
Data from:
Johnson JW, Oelkers EH, Helgeson HC (1992) Comput Geosci 18(7):899. doi:10.1016/0098-3004(92)90029-Q
and:
Pourbaix M (1966) Atlas of electrochemical equilibria in aqueous solutions. No. v. 1 in Atlas of Electrochemical Equilibria in Aqueous Solutions. Pergamon Press, New York.
Returns list of (name, energy) tuples.
We add two solids and one more dissolved molecule to the references,
convert them to a dictionary and create a Pourbaix
object using the class default arguments:
>>> refs += [('Zn', 0.0), ('ZnO', -3.323), ('ZnO2(aq)', -2.921)]
>>> pb = Pourbaix('ZnO', dict(refs))
We can determine what is the most stable phase at a potential of 1 V and a pH of 9.0, see the corresponding chemical reaction and determine the Pourbaix energy, i.e. the energy of the target material ZnO relative to the most stable competing phase:
>>> energy, phase = pbx.get_pourbaix_energy(1.0, 9.0, verbose=True)
Stable phase:
ZnO + H2O  ➜  2H+ + 2e- + ZnO2(aq)
Energy: 0.560 eV
As we can see in these conditions ZnO spontaneously decomposes
into acqueous ZnO2 and lies 560 meV above the latter species.
This chemical reaction is described by a ase.pourbaix.RedOx object.
We can show that, in the same conditions, the reaction occurs spontaneously
releasing the opposite of the pourbaix energy, i.e. -560 meV:
>>> print(type(phase))
<class 'ase.pourbaix.RedOx'>
>>> print(phase.get_free_energy(1.0, 9.0))
-0.5595239105125918
If we repeat the evaluation at a potential of 0 V and a pH of 10, we can see that ZnO is now the most stable phase (although barely), and the associated Pourbaix energy is (slightly) negative.
>>> pbx.get_pourbaix_energy(0.0, 10.0, verbose=True)
ZnO is stable.
Energy: -0.033 eV
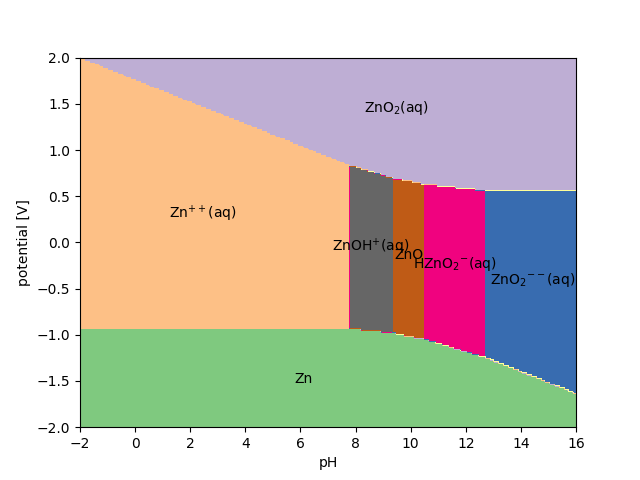
Finally, we can evaluate the complete Pourbaix diagram of ZnO in a potential window between -2 and +2 V, and a pH window between 0 and 14:
>>> Urange = [-2, 2]
>>> pHrange = [0, 14]
>>> pbx.plot(Urange, pHrange, show=True)
- class ase.pourbaix.Pourbaix(material_name: str, refs_dct: dict, T: float = 298.15, conc: float = 1e-06, reference: str = 'SHE')[source]#
Pourbaix class for acqueous stability evaluations.
Allows to determine the most stable phase in a given set of pH and potential conditions and to evaluate a complete diagram.
Initialization#
- material_name: str
The formula of the target material. It is preferrable to provide the reduced formula (e.g. RuO2 instad of Ru2O4).
- refs_dct: dict
A dictionary containing the formulae of the target material and its competing phases (solid and/or ionic) as keys, and their formation energies as values.
- T: float
Temperature in Kelvin. Default: 298.15 K.
- conc: float
Concentration of the ionic species. Default: 1e-6 mol/L.
- reference: str
The reference electrode. Default: SHE. available options: SHE, RHE, AgCl, Pt.
Relevant methods#
- get_pourbaix_energy(U, pH)
obtain the energy of the target material relative to the most stable phase at a given potential U and pH. If negative, the target material can be regarded as stable.
- plot(…)
plot a complete Pourbaix diagram in a given pH and potential window.
Relevant attributes#
- material: Species
the target material as a Species object
- phases: list[RedOx]
the available decomposition reactions of the target material into its competing phases as a list of RedOx objects.
- class ase.pourbaix.RedOx(species, coeffs, T=298.15, conc=1e-06, reference='SHE')[source]#
RedOx class representing an (electro)chemical reaction.
Initialization#
- species: list[Species]
The reactant and products excluded H2O, protons and electrons.
- coeffs: list[float]
The stoichiometric coefficients of the above species. Positive coefficients are associated with the products, negative coefficients with the reactants.
- T: float
The temperature in Kelvin. Default: 298.15 K.
- conc: float
The concentration of ionic species. Default: 1.0e-6 M.
- reference: str
The reference electrode. Default: SHE. available options: SHE, RHE, AgCl, Pt.
Relevant methods#
- from_species(reactant, products, T, conc, reference)
Initialize the class from the reactant as a Species object and the product(s) a list of Species objects.
- equation()
Print the chemical equation of the reaction.
- get_free_energy(U, pH):
Obtain the reaction free energy at a given applied potential (U) and pH.