Obtaining all-electron wave functions and electrostatic potential
Wave functions
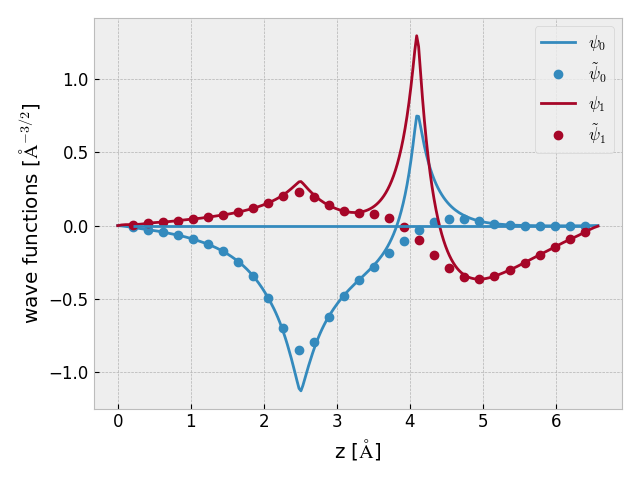
To get from the pseudo (PS) wave function to the all-electron (AE) wave
function, a PAW correction needs to be added. The correction will add the
cusp and all the wiggles necessary for the wave function to be orthogonal to
all the frozen core states. This tutorial show how to use the
PS2AE class for interpolating the PS wave
function to a fine grid where the PAW corrections can be represented:
- class gpaw.utilities.ps2ae.PS2AE(calc, grid_spacing=0.05, n=2, h=None)[source]
Transform PS to AE wave functions.
Interpolates PS wave functions to a fine grid and adds PAW corrections in order to obtain true AE wave functions.
Create transformation object.
- calc: GPAW calculator object
The calcalator that has the wave functions.
- grid_spacing: float
Desired grid-spacing in Angstrom.
- n: int
Force number of points to be a mulitiple of n.
Note
Versions 20.10.0 and earlier
The grid_spacing parameter was called h in older versions of GPAW.
Using grid_spacing in the older versions will give a
got an unexpected keyword error.
Here is the code for plotting some AE wave functions for a HLi dimer using a
PAW dataset for Li with a frozen 1s orbital
(get_wave_function()):
import matplotlib.pyplot as plt
from ase import Atoms
from ase.units import Bohr
from gpaw.utilities.ps2ae import PS2AE
from gpaw import GPAW

plt.rcParams['font.size'] = 12

hli = Atoms('HLi', positions=[[0, 0, 0], [0, 0, 1.6]])
hli.center(vacuum=2.5)
hli.calc = GPAW(txt='hli.txt', mode='fd')
hli.get_potential_energy()

# Transformer:
t = PS2AE(hli.calc, grid_spacing=0.05)

for n in range(2):
    ps = t.get_wave_function(n, ae=False)
    ae = t.get_wave_function(n)
    norm_squared = t.gd.integrate(ae**2) * Bohr**3
    print('Norm:', norm_squared)
    assert abs(norm_squared - 1) < 1e-2
    i = ps.shape[0] // 2
    x = t.gd.coords(2) * Bohr

    # Interpolated PS and AE wfs:
    plt.plot(x, ps[i, i], '--', color=f"C{n}",
             label=r'$\tilde\psi_{}$'.format(n))
    plt.plot(x, ae[i, i], '-', color=f"C{n}",
             label=r'$\psi_{}$'.format(n))

    # Raw PS wfs:
    ps0 = hli.calc.get_pseudo_wave_function(n, pad=True)
    gd = hli.calc.wfs.gd
    i = ps0.shape[0] // 2
    X = gd.coords(2) * Bohr
    plt.plot(X, ps0[i, i], 'o', color=f"C{n}")

plt.hlines(0, xmin=x[0], xmax=x[-1])
plt.xlabel(r'z [$\rm \AA$]')
plt.ylabel(r'wave functions [$\rm \AA^{-3/2}$]')
plt.legend()
plt.tight_layout()
plt.savefig('hli-wfs.png')
hli.calc.write('hli.gpw')
plt.close()
- PS2AE.get_wave_function(n, k=0, s=0, ae=True, periodic=False)[source]
Interpolate wave function.
Returns 3-d array in units of Ang**-1.5.
- n: int
Band index.
- k: int
K-point index.
- s: int
Spin index.
- ae: bool
Add PAW correction to get an all-electron wave function.
- periodic:
Return periodic part of wave-function, u(r), instead of psi(r)=exp(ikr)u(r).
Electrostatic potential
The relevant formulas can be found here: Note on electrostatic potential.
Here is how to extract the AE potential from a gpw-file using the
get_electrostatic_potential() method:
import matplotlib.pyplot as plt
from ase.units import Bohr
from gpaw.utilities.ps2ae import PS2AE
from gpaw import GPAW

calc = GPAW('hli.gpw', txt=None)

# Avarage PS potentials:
vh, vli = calc.get_atomic_electrostatic_potentials()
zh, zli = calc.atoms.positions[:, 2]
rh, rli = [max(setup.rcut_j) * Bohr for setup in calc.setups]
plt.plot([zh - rh, zh + rh], [vh, vh], label=r'$\tilde v$(H)')
plt.plot([zli - rli, zli + rli], [vli, vli], label=r'$\tilde v$(Li)')

# Transformer:
t = PS2AE(calc, grid_spacing=0.05)

# Interpolated PS and AE potentials:
ps = t.get_electrostatic_potential(ae=False)
ae = t.get_electrostatic_potential()
i = ps.shape[0] // 2
z = t.gd.coords(2) * Bohr

plt.plot(z, ps[i, i], '--', label=r'$\tilde v$')
plt.plot(z, ae[i, i], '-', label=r'$v$')

# Raw PS potential:
ps0 = calc.get_electrostatic_potential()
gd = calc.hamiltonian.finegd
i = ps0.shape[0] // 2
Z = gd.coords(2) * Bohr
plt.plot(Z, ps0[i, i], 'o')

plt.plot(z, 0 * z, 'k')
plt.xlabel('z [Ang]')
plt.ylabel('potential [eV]')
plt.ylim(bottom=-100, top=10)
plt.legend()
plt.savefig('hli-pot.png')
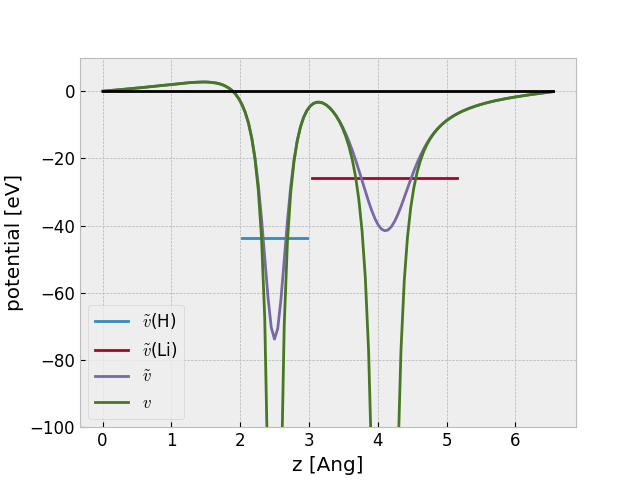
The figure also shows the avarage PS potentials at the atomic sites calculated
with the
get_atomic_electrostatic_potentials() method.
Pseudo density
See: